Recent Posts

Pages: 1 ... 5 6 [7] 8 9
61
Commodities Trading / Re: The Options Advantage
« Last post by TradingAdmin on April 19, 2016, 10:23:30 am »
In the previous post we highlighted an important factor - the RISK in the trade..  Today we explore that risk...

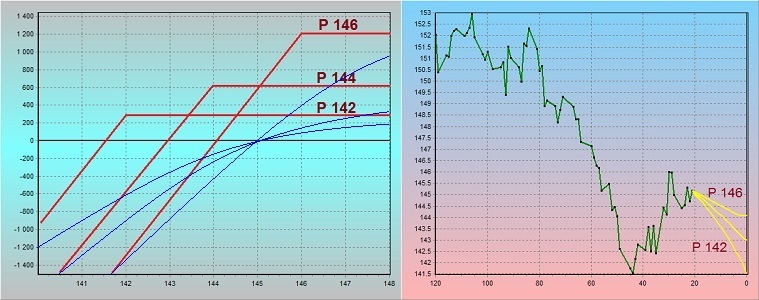
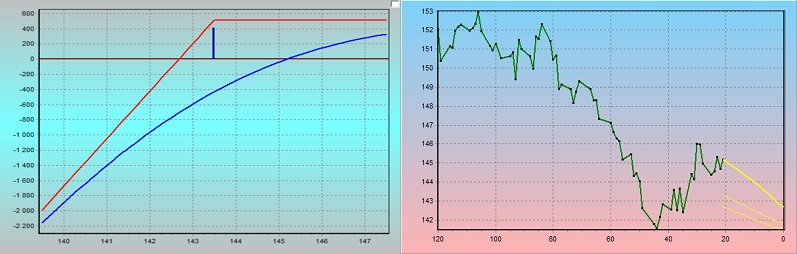
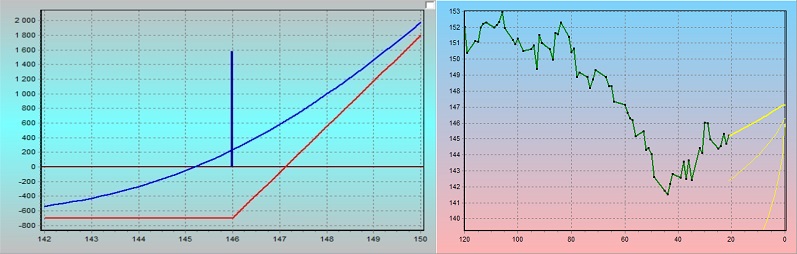
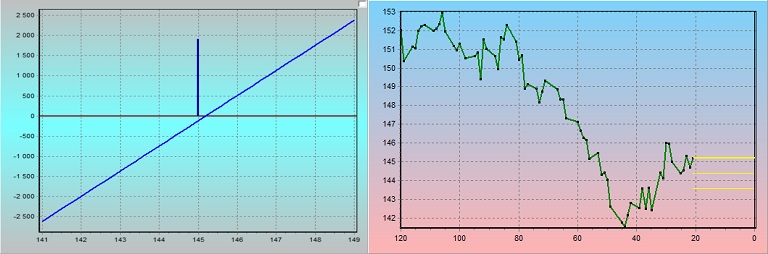
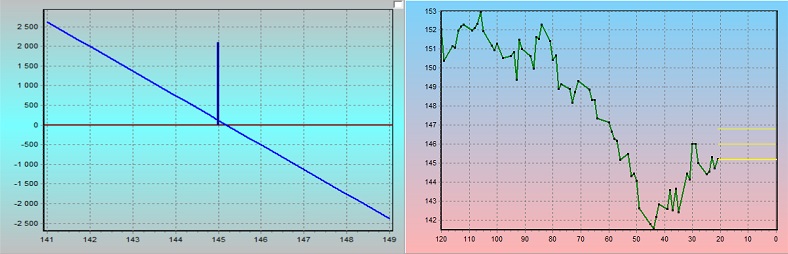
Here are two of the trades above, on separate graphs - the P146 and the P142:

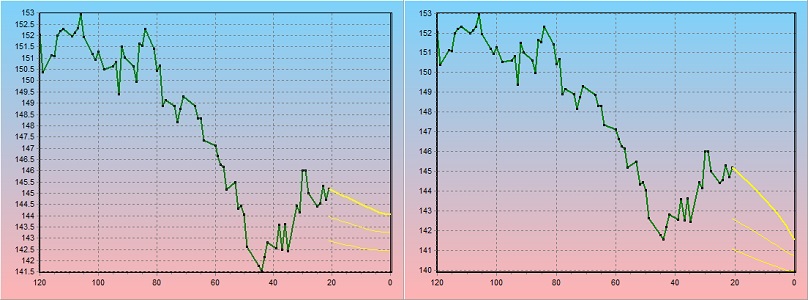
Shown on the graph is the break-even line as well as the lines for a -$500 and a -$1000 loss respectively.
You will notice that with the P142 (right), the price at which you will take a -$500 loss is less than where on the P146 (left) you would have already taken a -$1000 loss!

What is risk
It does not matter what trade position you try to take, there is always the "chance that you will be wrong".  And when you are wrong, you will loose money.  How much money you loose is entirely up to you - it depends on how long you want to stay in before taking your loss.
(This by the way is where most traders fail, or loose the plot.  They fall for all the marketing crap about how easy it is to make money from home, trading the Forex markets.  They try a few trades and they make a few bucks.  Then one day they run into a loosing trade, but they have never learned when to get out, thus they incur a loss.  But they stay in, hoping the currency will turn around and the loss becomes a big loss.  Then they argue that:  "if I get out now, I will realise that loss.  It is better I hang on, the currency have to correct, go the other way, then when the loss is smaller, then I'll get out".  Then the currency does correct and the loss is smaller, but then they say "OK, finally things are going my way..- just a little bit more and I'll be able to get out with no loss..- just a little bit more".  They stay in, the currency turns around and goes back the other way.  Now suddenly the big loss of before turns into an even bigger loss.  At this point, most traders suddenly find faith in the Lord - because for the first time in their lives they actually find they are praying to the Lord - something like "Please Lord, let it just go back to where it was before, PLEASE, I promise I will go out then, I cannot take this massive loss, please Lord".  And...  well, sometimes the Lord listens, but the trader does not get out, sometimes the Lord does not listen.  Regardless of whether the Lord listens or not, invariably the trader takes a massive loss and he is done with trading - this does not work for him.., well for the next year - then he thinks about it and how stupid he was not getting out, and then he decides this time it will be different and then he tries his hand at the Forex game again...)

Risk is the chance that you will be wrong.  But risk is more than that, it is also how much you will loose when you are wrong.  Now how much you will loose is quantified for you in the two graphs above.  You can see that for the P142 you will loose less at any specific price level than what you will loose with the P146 - provided you get out of course.

The chance that you will be wrong
No one can predict (accurately) what the markets will do - if we could (1) we would have been millionaires and (2) we would not have shared that knowledge with anyone - for this reason, the moment that someone tells you they have found the holy grail of methods - here is a method to make a guaranteed income out of the market..- RUN!

There are two things that influences the chance that you will be wrong:
  • TIME:  The more time you give a particular market to reach your break-even point, the point from where you will be incurring a loss, the higher the chance that the market will get there.  A lot of things can happen in a 100 days!  If you give the market 100 days to reach your break-even point, the chance is quite high that something will happen and the market will give you a loss.  However if you only give the market 5 days to react - it is a bit difficult.  Un upwards moving market cannot just stop and rocket down for nothing - it needs time to make a change!
  • DISTANCE from the Price Action: It should make sense that the further away you are from the current price action, the further the market has to move to get you into trouble, the less the chance that that will happen and therefore the less the risk!

This is what is depicted above!  For the P146, you are trading at a price of 146, which is above the current price level of the market.  Just a small move down and you are into trouble.  With the P142 you are trading at a price that is waayyy down on the price chart - you are far away from the price action - the market has to move substantially down before you are getting into trouble.

You also see an element of time here.  With the P142 you are really putting pressure on the market - not only does it have to move down to get you into trouble, it has to keep on moving down, every single day to keep you into trouble!!  We are asking a lot of the market in this position - we are almost trying to force the market's hand (if the market wants to get us in trouble)

And so now the choice:  Do you take $1200 out of the market and take the risk for the P146, or are you happy with only $285 and take the risk for the P142?  And if you really would like the $1200, why not rather take 4 of the P142 trades - same kind of profit, but much less risk?

Conclusion
There are two things that should be clear:
  • Stay away as far as possible from the price action
  • Squeeze the market for time!

Next time we will look at one way to do this..
62
Commodities Trading / Re: The Options Advantage
« Last post by TradingAdmin on April 14, 2016, 09:05:49 pm »
It's been a while....

OK, so we saw that not only can we reduce the risk in a trade by trading an option (instead of the futures), we are also able to shift the break-even line into our favour - in other words we are able to buy space for ourselves to be wrong about a trade. (This the case when we Sell an option)

What I want to show you here, is the relationship between the strike price at which we sell our option and the risk that we are taking.  First the picture:


Try to not get confused here - there are three different options strategies depicted here, all three on the same graphs in order to compare them.  The three cases are for selling a PUT option at a Strike Price of 146, 144 and 142 respectively (P146 means Put @ strike of 146). So now:
  • First, note that our currency is currently trading at a price of just over 145 !!  Our currency (GBP) has a point value of $625.  Thus for each 1 point that the futures move, the contract that you are trading in will gain or loose $625!!  To be clear, if you bought the currency at 145 and the price moves up to 146, you will make $625 in profit, likewise if the price drops to 144 you will loose $625.
  • We are selling PUT options here.  A PUT option will give the owner of the option - the person to whom we are selling these options - the right to go SHORT the currency, in other words if the option owner decides to exercise, he / she will SELL the currency at the option's strike price.  The option owner expects the price to go down, so that he / she can profit from it
  • We on the other hand want the price to move up, in which case exercising the option will make no sense to the option owner and we will keep the premium that we received for selling the option
  • The first option we sell is a P146.  The strike price is ABOVE the futures current trading price!  In other words, there is immediately VALUE in this option - the owner (of the option) may SELL GBP at 146 and immediately buy it at 145.2 (the current price), realising a profit or (146 - 145.2)*625 = $500.  BUT, the buyer has to pay us $1200 for this option!!  Thus immediately exercising the option does not make sense.  However, let's not focus on the buyer, let's focus on ourselves.  We will receive $1200 for this option.
  • Also shown is a P144 option (144 strike), for which we will get $620 and a P142, for which we will receive $285.  Thus, the further we move away from the current price of the futures, the less money we will be paid for the option - it makes sense, the further away me move from the price, the less the risk that the futures will hit our price, the less a customer is willing to pay for insurance to protect against such a price move.  (and selling options is nothing more than selling insurance premiums)

On the risk side:
  • Looking at our risk graph (right side), the further we go from the price (the lower the strike price) the steeper the break-even line gets.  Considering that we are thinking that price will move UP, the steeper down the break-even line, the more chance we buy ourselves to be wrong and still make a profit!  Look at the P142 - the break-even line curves really sharply down.  Price not only needs to go down, it needs to go very sharply down before we will be making a loss!!  We have to be absolutely completely wrong about the future price direction for us to make a loss!
  • This is also illustrated on our profit loss graph (left-hand graph).  Look at the red lines.  A price anywhere above 142 on expiry day (21 days from today) and we will keep the $285 for the P142.  Compare this to the P146:  Although we will make more money, price have to be above 146 for us to keep that money!
  • The blue lines depicts the situation on entry day.  If the price should drop to 144 on entry day, then with the P142 we will be down (loss) of -$180.  With the P146 we will be down -$400!  And from there it turns down sharply!

So what can we say about all of this?  It is all about YOUR APPETITE FOR RISK!!  If you are absolutely 100% certain that the price will move up, then go for the P146.  Or just long the futures.  It gives you the highest possible return.  BUT, if you are wrong, you are going to loose a lot and you are going to loose it fast.  If you are more conservative, and willing to make less money, then the further away you trade from the price action, the more chance you have of making a profit.  Even if you are wrong, you may still be able to get out of the trade with a small profit!

It is all about RISK versus GREED.  If you are GREEDY, take more risk, you may make more money when you are right, but you will loose more every time that you are wrong.  If you are risk averse, a safer bet may be to stay far away from the price action, take less profit at a time, but loose less when you are wrong!

Of course I have to ask the question:  Would you rather trade one contract with a P146, earning $1200 for the contract, but only if the price closes above $146, OR, trade four (4) contracts of the P142, earning $1,140 and keep that money as long as price stays above $142 ?
63
Commodities Trading / Re: The Options Advantage
« Last post by TradingAdmin on February 22, 2016, 05:21:08 pm »
Quote
So now the question - is it possible for us to reduce the risk in our trade (like we did here) while simultaneously also turning that break-even line into OUR favour...?

You mean, like this...?


(Those two loss lines, as in the previous example, again at $500 and $700 respectively.)

Thus to answer the question - YES IT IS!!  We ARE able to:
  • Drastically reduce the downside risk - versus our futures trade, while simultaneously
  • Shift our break-even profit line hugely into our favour!!

HOW DID WE DO THIS!?

In this case, we SOLD an Option!  That's right we SHORTED a PUT Option.  The net result is like below:


There are some changes here:
  • Someone somewhere PAID US money to take this position.  That is 100% right - instead of us forking out money for this trade, someone else paid money into our trading account for us to take this trade - $500 to be exact.  When we entered this trade, we received $500 into our trading accounts for us being willing to take this risk.  And we will keep this money - the transaction is concluded, the money is ours, we will never give it back
  • Our downside risk, as was the case for trading in the futures, is again potentially unlimited.  HOWEVER, the price level at which we will take that loss has shifted down significantly! While with the futures we would have taken a loss of $500 at 144.3 and a loss of $1000 at 143.6; we will now take a loss of $500 only at 143.2 and $700 loss at 142.7  - in other words we have much more room to realise we are wrong and get out of that trade
  • Our loss lines decreases over time!! - That is as time goes by, the currency has to drop more and more before we will take a loss - in roughly two weeks from the day we entered, the $500 loss mark shifts down further from 143.2 to 142!
  • Our profit potential however is now LIMITED.  It is limited to the $500 we have received beforehand - we no longer have an unlimited profit making potential
  • Our break-even line however slopes sharply downwards.  Not only will we make a profit if we are right and the price goes up, we will now also make our money if the price stays level, or even if the price drops, as long as it does not drop too quickly!!

This extremely favourable position was brought about by us willing to limit our profit potential in the trade.  By not being greedy, by being willing to settle for a maximum of $500 in profit, the market rewarded us with a very favourable position - one where we are even allowed to be wrong on the market direction and still make a profit!
64
Commodities Trading / Re: The Options Advantage
« Last post by TradingAdmin on February 19, 2016, 10:36:17 am »
Today we take exactly the same situation, but we trade it with an Option instead.  We BUY a CALL OPTION. 

Now note:  When you do this you are not actually entering the market - in other words you are not subject to the price fluctuations in the market.  You have a contract (a guarantee) by which you may enter the market if you choose to and when you choose to, at a pre-determined price - regardless of where the actual market is trading - as long as you do it before your contract expires.  You are basically sitting on the side-line, watching what the market does and if the market turns in your favour, then you enter and take your profit.  If it does not, you keep sitting on the side-line, waiting..


Soo..- we BUY a CALL OPTION at a strike price of 146!

Thus, we may enter the market at a futures price of 146 (long the futures, or buy the futures - exactly the same as our first trade) at any time from this point forward until expiry, 21 days from today.  At a price of 146 - regardless of where the actual market is trading.  Yes even if the market is trading at 150, we may still enter at 146 - our option guarantee's us an entry at 146!!

What happened to our RISK in this trade?  Well, first off, our profit is still potentially unlimited.  Our risk (downside of the trade) however is now limited TO A MAXIMUM LOSS of $700.  This is the most profound change - we CANNOT loose more than $700 on this trade!  With the futures, our downside risk was unlimited, we could easily loose $1000 or more.  No more!  With this trade the absolute maximum loss is $700.  If you take a look at the risk graph, the two feint yellow lines shows you where you will take a $500 loss and a $699 loss respectively.

Compare this to your straight currency trade.  There you would have taken a $500 loss at a price of approximately 144.3 and a $1000 loss at a price of 143.6.  With our options trade, you will only take a $500 loss at a price of 142.5; you cannot take a $1000 loss, the maximum loss possible is $700!

What did the option do for us?  It bought us the right to be wrong about the market direction!!  It safeguards us against the market moving in the wrong direction...

What is the price that we have to pay for this?
Of course one cannot expect such a favourable position for nothing - there must be a downside!  You can see the downside in your break-even line.  With the futures, the break-even line were horizontal at 145.2.  With our option, the break-even line starts at 145.2, but then slopes upward to just above 147.  In other words, before - with the futures - we would have made money the moment that the price of our currency pair increased.  With our option the price increase has to follow at least the rate of our break-even line, otherwise we will loose.  Also, our loss lines are no longer fixed, they also slope up towards our break-even line.  In other words time has become an enemy - the more time goes by, the more critical it becomes that the currency pair does increase in value.  That's the price we had to pay for reducing our downside risk!

But risk-wise, we are much better off than with our futures trade!


So now the question - is it possible for us to reduce the risk in our trade (like we did here) while simultaneously also turning that break-even line into OUR favour...?


65
Commodities Trading / Re: The Options Advantage
« Last post by TradingAdmin on February 17, 2016, 01:31:45 pm »
As our first trade, let us look at a FUTURES Trade.  We go LONG the currency at the current price....

What does this mean?  It is a straightforward currency trade - we BUY the exchange rate, on whatever platform you use.  The risk profile looks like this:


Your expectation is that the price will increase.  If it does, you make money.  Your potential profit is unlimited.  If you are wrong, you loose money, your loss is also potentially unlimited.  There is only one line on our profit/loss graph - your profit/loss is the same the day that you enter than 5 days from now than 20 days from now, it depends only on whether the price goes up or not.

Your risk graph shows the break-even line (bold yellow) as a horizontal line at the price that you traded.  If the price goes above this line, you make money, if it drops below this line, you loose money, as simple as that.  The two feint yellow lines show where you will be taking a $500 loss and a $1000 loss respectively, trading only one single contract.

If you look at the daily price graph, you will see for days 52, 35-34, 32, that there are potentially large price changes in a day, average price change is about, or slightly more than 1 point in the currency.  You can take a $1000 loss in a day, but risk on average is just more than $500 per day.  This is quite a risky trade.

This is the kind of risk you take on on ANY of the many different trading platforms trading in the Currencies.  You cannot afford to take your eyes of this trade - if you get it wrong, you can loose big-time, and you can loose fast.  You need to be wide awake, you need to be glued to your computer screen, you need to be very quick in your reactions, get out at the smallest indication that something is not right, or you can very easily and very quickly loose a substantial amount of money.  Welcome to the world of trading in the Currencies!

Note: To the Currency Trader, on any of a number of different platforms, and extremely aggressively marketed on social media and via many different trading advertisements and seminars and stuff.. - this is the only option you have for trading the markets, this is the only trade you can make.  You can either buy and hope the price will increase, or sell and hope the price will decrease (SHORT position in the markets depicted below - you'll see it is the same thing, except you make money if the market drops).


Tomorrow, we'll look at trading the same situation, but with an OPTION...
66
Commodities Trading / The Options Advantage
« Last post by TradingAdmin on February 16, 2016, 09:45:29 pm »
This discussion topic is motivated by a friend..- well, we have not actually met yet, we got acquainted via email, currently he is on a mission away from home for 3 months, but with lots of questions on his mind.  For you, my friend - something to keep you busy through the lonely afternoons.  For anyone else following this, you are of course most welcome to participate...

I'll use this discussion topic to show a couple of trades involving trading in the straight futures - (such as what anyone who got involved in currency trading for example, would be very familiar with) - versus trading with various different options positions.  You then judge which is the more risky approach?

First off, I'll use two graphs from out of the Options Explorer on all these posts, as follows:


The graph on the LEFT is a profit / loss graph.  It shows us the profit / loss that you will make on the left axis, versus the price of the commodity (or instrument) that you are trading in on the bottom axis.  The RED LINE will be the profit / loss situation on the day that the futures instrument expires - in this example 21 days from today.  The BLUE LINE is the profit / loss situation on the day that you entered the position (in other words today).  The PURPLE LINE is the profit / loss line on an arbitrary date into the future - in this case it is 9 days into the trade.  Thus the profit / loss line is time dependant (naturally, since the price of the commodity will change over time).  The vertical bars are the prices at which we entered individual positions.  The solid vertical line represents the price on the day that we are analysing - in this case day 9, the price is at 145, you can read the profit from out of our graph on this day from the purple line.

The graph on the RIGHT presents exactly the same information, but in this case it super-imposes the profit loss in our trade position on top of a line chart of the daily closing price of the underlying commodity (price chart in GREEN).  Our profit / loss lines are drawn in YELLOW.  The thick (bold) yellow line is our break-even lines (in this case, between the two thick yellow lines we are making a profit, outside that area we are making a loss - note sometimes this will be reversed, and sometimes there will only be one line.  The feint yellow lines tells you on which side of the break-even line we are in trouble, obviously on the other side we are in profit).  The two feint yellow lines represent loss lines - in this case a $500 loss and a $1000 loss respectively.  Futures price on the left axis, days left until the futures expires on the bottom axis.  We are able to simulate price action on this graph - I have added nine days on this graph, keeping the price constant at 145.  Thus this graph shows we are in profit (9 days in if the price stays level) and the graph on the left shows us how big that profit is (about $700 - pink line at a price of 145)

These graphs shows you the underlying risk in a trade situation - how much money can you make and how much can you loose, and what does the price of the instrument you are trading in have to do for you to make a profit, versus for you to make a loss.  (In the example above (USD/GBP) it should be clear that we are expecting the price to stay level - if that happens we will be making a profit.)

Study and familiarise yourself with these graphs - we will be using them to describe different positions.

67
Commodities Trading / Re: What happens when the market gets emotional?
« Last post by TradingAdmin on June 12, 2015, 12:54:23 pm »
Herewith the follow-up post as promised...

Let us look at this Crude Oil trade from a slightly different angle.  I am going to use Options Explorer and draw the same picture as above in a slightly different format (I turn the graph sideways and super-impose it over the price chart for crude oil, but I am only drawing the break-even lines for the position we are setting up)


Again, we are SELLING two options, a $62 strike price CALL option and a $58 strike price PUT option.  The premium we collect is $3,100.  We will be making a profit (up to a maximum of $3,100) if the price of crude oil stay between the two yellow lines!!

Now it is easy to see that IF the price of oil is going to stay level, that is IF crude oil will continue to trade up-and-down between 58 and 62, then this strategy will make us money.  At the bottom of the graph we can see the time left and looking at the graph you can see between which prices crude oil needs to stay each day in order for us to be profitable.  You can also see that on expiry day (in 36 days time) those two prices are $55 and $65 - thus the same information as the graph in the previous post (the expiry day red line).

Of course, us entering into this trade means someone else somewhere in the world is entering into the opposite position.  Whoever is in the opposite position bargains on the price of crude oil moving OUTSIDE of these two yellow lines in order for this party to make a profit.  The question is, "where do YOU want to be?"
  • Would you like to position yourself to make a profit with crude prices between those two yellow lines, or
  • Would you rather make a profit if Crude Oil trades outside those two yellow lines?

It really depends on your view of the market!  Where do you believe Crude is going to go over the next couple of days !?

THUS, LET US NOW ADD EMOTION INTO THE PICTURE !!

First, what if the market calms down, if the market starts relaxing - what if the IV for Crude Oil decreases?  If the emotions of the traders making up the market calms down over the next 20 days?


The market calming down has a dramatic effect!  Would you still like to be positioned OUTSIDE those two yellow lines, or would you rather take your changes BETWEEN those lines?  Note:  It looks good but you can still loose!  There is no such thing as a guaranteed win!  If the price of crude suddenly overnight shoots up, or melts down you can still make a loss on this trade!  But the probability favours the Traders that has positioned themselves BETWEEN these two lines!

NOW, what if the emotion in the market rises, what if economic or political events causes traders to become scared, frightened, what if Traders' perception of risk increase and the IV for Crude Oil increases over the next 20 days?


Gheez..!!  This is an equally profound change!  Finding yourself BETWEEN those two yellow lines now seriously threatens your profitability on this trade - chances are you are going to loose!  In this case whoever positioned themselves OUTSIDE those two yellow lines have by far the best chance of success with this trade!

SO NOW:

Can you afford to enter into this trade without ANY knowledge of the emotional state of this market?
If you could first, before deciding where you would like to position yourself in this market, get information on the emotional state of the market, will that influence the way in which you trade this market?  In other words where you position yourself?

Options Explorer does exactly that!!  Every day it calculates the emotional state of ALL the markets we are interested in and rank them for us from high to low..  Which allows us to determine (1) the markets we'd like to trade in and (2) how we'd like to position ourselves in that market for the maximum possible chance of success!! 
68
Commodities Trading / What happens when the market gets emotional?
« Last post by TradingAdmin on June 12, 2015, 12:30:38 am »
And you thought your wife is the only one that gets emotional?  Wait until you see what the market does!

The price that the market charges (or is willing to pay) for an option is determined by risk.  The higher the perceived risk, the more the market will charge (or be willing to pay) for the option.  Risk in turn is determined by three things: (1) how far the strike price of the option is from the actual futures price, (2) how much time is left before the option expires, and (3) and this is the most important, the perceived risk in the mind of the investor.  We measure this risk as a value called the "implied volatility" or IV in short.  When market conditions are calm, investors will be calm, the IV will be low and the options will be cheap.  But if something changes and investors become frightened (emotional, scared, worried), the IV will rise and option prices will likewise increase - the perceived risk will rise..

Let's take an example.  Here is Crude Oil (WTI Crude, August 2015 futures contract):


Crude has reached a plateau, an area where it is going nowhere, it is trading sideways.  In this state it can continue to move sideways for a considerable period of time - we can see it is moving roughly up-and-down and up-and-down between a price of $62/barrel and $58/barrel.  While you cannot trade this with a futures - for fear of being whiplashed up-and-down, we can trade it with an options strategy by simply selling an option both above and below the price range. As follows:


The graph above taken from Options Explorer.  We sell a Call option at $62 and a Put option at $58.  We collect a total of $3,100 in premium from the market for these two options - that is right, the market pays us a non-refundable premium for taking this risk.  On the left side is shown your profitability and on the bottom axis the price of the oil futures.  The red line shows us the profit / loss at options expiry (which is 36 days from today).  The blue line shows us our profit / loss on the day that we enter the trade (that is today).  We setup this trade when crude is trading at close to $62 per barrel - at that point (today, blue line) we see we are at $0 profit.  Should the price drop we'll make a little profit, should the price increase we'll loose.  At the end of the contract (36 days, red line), if Crude is still trading between 58 and 62, we will make $3,100 profit; if between about $55 and $65, we'll still be making a profit (less than $3,100, but a profit nonetheless).  Below $55 or above $65 we'll be making a loss - on expiry date.  It is a nice trade, provided Crude does as expected and continue to move sideways!

Thus, if all goes like planned and crude continues to move sideways, then over the next month we'll be making some really nice profit for.., well, for us doing nothing, we just wait while our money works for us.

That is... unless the market becomes emotional!  Consider the situation 20 days into this trade:


  • If the market suddenly becomes emotional, that is if investors become scared for some or other reason, their perceived risk increases, then if we look at the dark blue line (bottom line), we will be looking at a loss, no matter the price where crude trades at
  • If on the other hand the market calms down, investors becomes calm, unemotional, relaxed, then the yellow line shows that we will be making a lot of money
It does not matter what price Crude is trading at or how much time is left (it does, but it plays a small role) - the market is controlled by EMOTION!!  If investors become scared and the emotion rises we will be in trouble!  If the market calms down, we will be into serious profit.  Take any price!  Take a price of $60 - right in the middle of the trading range - if the market is scared, we'll be looking at a loss of close to $700!  If on the other hand the market is calm, we'll be looking at a profit close to $3,000!  ALL just based on the emotion of the market!

What does this mean!??

It simply says - ask the question, before you enter into the market..- "What is the emotional state of this market at this point in time!?"
If we know the answer to this question, then we know what to do..!!  For if the market right now is volatile, scared, emotional, then this is a really great strategy!  If prices moves sideways for a couple of days, then the market will calm down and just the fact that the market calms down will make us a lot of profit!!
BUT, if the market is already calm at this point - well then the risk is there that the market will become emotional (it will not calm down, it is already calm), then you have to ask yourself whether it is worth taking this trade or whether you should rather look for a different commodity, a different market!?

Can you see where this is leading to?  There is more into trading than just entering a position - if we had a way to determine the market's emotional state before entering a position, we can ensure that we create ourselves the maximum chance of success - we can put the probability in a trade into our favour!

We'll explore this concept a bit further in a follow-up post..
69
I think this is the wrong question.  The right question is what makes Options Trading so different?
Look at the graph below:


This is a daily price chart for Lean Hogs, or bacon - the stuff you eat for breakfast in the morning.  You can trade in bacon.  Every $1 in price (from one horizontal line to the next) is $400 profit or loss.  Thus if you can predict the direction for the next price move correctly, you can make good money - of course if you get it wrong you will loose good money as well.  With the price chart as it is at the moment it is a bit hard to tell which direction the price is likely to go, thus you'll be taking a bit of a chance if you enter into this market - there is no clear direction.. 

That is if you trade it the normal way..

Below I am going to trade this same market with OPTIONS:


If the price of hogs (the red line) enters between those two thick yellow lines, I'll make a profit on this trade.  If at the end of the graph (two weeks from today) the red line is anywhere between those two yellow lines, I'll be making a profit of $690!  On the "down" side, if I am wrong about the price and it moves outside of those two yellow lines, I'll make a loss. 

How much of a loss? By the time the price reaches the two feint yellow lines, $100 - but that is a long way for the price to go and I will realise that I am wrong a long time before that and get out - with a much smaller loss!

THUS, what does trading options allow me to do
It allows me to manage the risk in this trade.  It allows me to, in the face of uncertainty, setup a trade where I take a really small risk, in return for making a very reasonable profit.  I don't anymore have to get the next price movement exactly right, it can go up or down, it can go outside my bounds a long as it returns inside.  I am not going to make or loose money in a matter of minutes - I have got 18 days (weekends included) over which I may carefully monitor what my trade is doing.  In other words, I can set this up and continue with my life, my day-to-day making a living business, whatever it is that you do - and just carefully monitor this situation in the evening when I have time. 

I basically have a trading business that I can do in parallel with my normal day-to-day business - it does not need me to sit in front of a computer screen for hours to wait for the market to do a move which I have to time perfectly in order to make something! I can relax, go on with my life while simultaneously building my trading account..

This is what TRADING OPTIONS allows me to do!

What makes Options Explorer so different is
  • It provides me with a complete trading course into options - not only a beginners course - a COMPLETE beginners to advanced options trading course.  It provides me with ALL the different trading strategies for ALL the different market conditions - trending markets, level markets, volatile markets, fast paced markets, slow paced markets, etc.  It allows me to setup positions, play with prices or different positions, change stuff, simulate it, all to get a 'feel' for the market and for how my strategy will work, etc.
  • It provides a platform to search the live market, through hundreds of thousands of different possibilities, to identify the opportunities - such as the one above, that gives me the maximum chance of success.  Have a strategy you like? Ask the Options Explorer to search the market for the best possible combination of options, the perfect market where your strategy right now will stand the max chance to succeed - the Options Explorer will sieve through ALL the markets, ALL the opportunities and highlight you exactly where, right now, which market, the perfect opportunity is available for your strategy to make you some money!

This is what makes the Options Explorer different!  You have a tool that will give you ALL of the assistance you need in order to build yourself a trading business that will last - a business you can slowly build up while doing your daytime job, to in the end provide you a business which may well become your primary source of income.

(What was the outcome of this trade?  I don't know - this was Lean Hogs on Friday the 29th of May 2015, today is the 30th - we'll have to wait and see what happens!?)
70
Yes, you may trade commodity futures and commodity futures options on the SAFEX, in South African Rand.  There are mainly two reasons why we choose the US markets:
  • Liquidity:  The number of traders in the market determines how fast you are able to execute an order when you want to enter / exit the market.  You cannot afford to want to exit the market, but are unable to because there is no one available to take the opposite position from you.  If that is the case you will not be able get the price you want and may have to settle for a less favourable price.  We cannot afford this.  With the US Commodities, there is no problem with regards to liquidity.  The US Commodities markets sees billions (yes billions, not millions) of dollar changing hands every day - there is no liquidity problem.  When you want to get in or out of a market there is immediately a buyer (seller) available willing to take the opposite position from yourself
  • Data: We need data in order to make informed decisions.  The data we need are collected for all commodities in the US markets, by independent companies and the data is made available.  The same is either not collected, or is not available for the SAFEX - without the necessary data we are blind, we are in the same boat as the professional trader and simply by this being their profession they will beat us in the markets.  We need data, the right data, in order to give us an edge over the market to allow us to beat the market!
Pages: 1 ... 5 6 [7] 8 9